- NagiosQL – www.nagiosql.org
- opsview.org http://opsview.org/featuresummary
- FAN: Fully Automated Nagios http://fannagioscd.sourceforge.net
- Centreon http://www.centreon.com
- Icinga https://www.icinga.org
- Shinken http://www.shinken-monitoring.org/
- GroundWork Monitor Community Edition :: GroundWork Open Source (GWOS)
http://www.groundworkopensource.com/products/community-edition/index.html - Xymon http://www.xymon.com/
- PHP Server Monitor http://sourceforge.net/projects/phpservermon/
- Zenoss Core http://community.zenoss.org/
- Hyperic http://www.hyperic.com/
- Monitorix http://www.monitorix.org/
- https://github.com/fzaninotto/uptime
- https://github.com/arachnys/cabot
- https://github.com/naparuba/shinken
=================================================
Nagios Status Information (NSI)
http://nsi.muehlbachler.org/?nav=demo
phpWatch | Get phpWatch at SourceForge.net
http://sourceforge.net/projects/phpwatch/
Limph | Get Limph at SourceForge.net
http://sourceforge.net/projects/limph/
SerMon – Open Source PHP Server Monitor
http://lab.openwebspider.org/sermon/
PhpWatchDog | Get PhpWatchDog at SourceForge.net
http://sourceforge.net/projects/phpwatchdog/
PHP-WebStatus Monitor | Get PHP-WebStatus Monitor at SourceForge.net
http://sourceforge.net/projects/php-webmonitor/
PHP Server Monitor | Get PHP Server Monitor at SourceForge.net
http://sourceforge.net/projects/phpservermon/
=================================================
Community
- https://www.monitoringexchange.org/
- http://www.nagios-portal.org/
- http://www.supermonitoring.com/blog/the-updated-list-of-website-monitoring-services/
=================================================
10 Free Server & Network Monitoring Tools that Kick Ass
November 4th, 2009 by Ben Dowling | 81 Comments | Stumble It! Delicious
server/network monitoring tools that will supervise your infrastructure for any issues that may arise. These tools are meant to aid you in avoiding being taken offline and evaluating if your resource needs has outgrown your infrastructure. In this article, we review our top 10 server/network monitoring tools. You will see a variety of server applications here so that you might find the tool (or tools) for your needs.
1. Monit
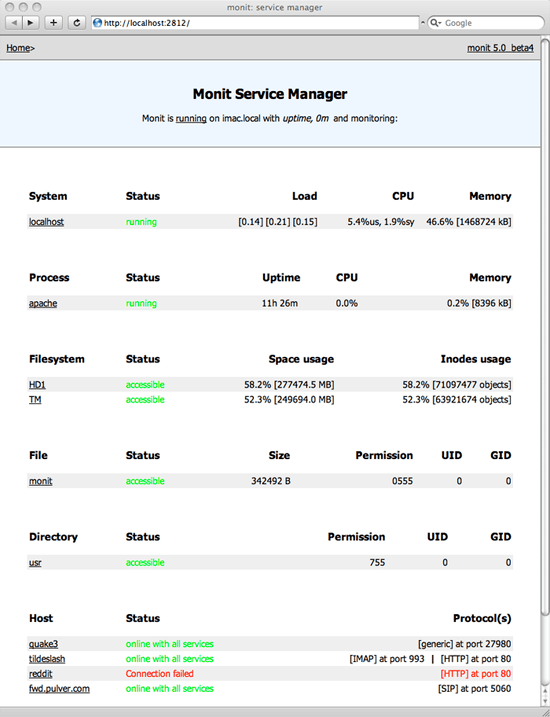 Monit not only monitors your server, but also attempts to remedy problems by taking predefined actions for certain situations. For example, if your database server crashes, Monit can automatically restart the service if this is the action that you want to take (hint: it usually is). If you have more than one server that you need to monitor, then you can use M/Monit– an extended version of Monit that provides a simple way to monitor multiple machines. There’s also an iPhone app available for M/Monit to help you conveniently check on your network without lugging around a laptop around.
2. Ganglia
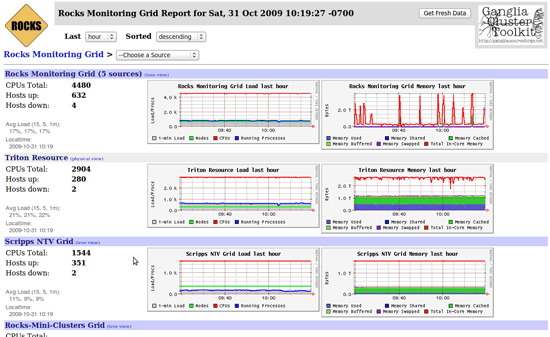 When you have a cluster of machines, it’s difficult to see how the whole cluster is doing all at once. Ganglia, instead, presents an overview of the whole cluster. This is a great tool to have set up when you’re working with a server cluster; with that said, it may be overkill for single-machine set-ups.
3. Munin
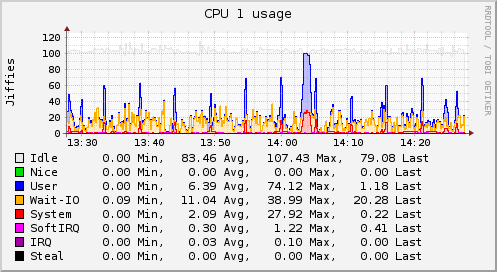
 Munin monitors and graphs system performance metrics. It can automatically produce daily/weekly/monthly/yearly performance graphs and reports of many important metrics. It comes with the ability to monitor core system resources, such as memory, disk space, CPU usage, server applications such as MySQL, Apache, and Squid. One of Munin’s greatest strengths is how simple it is to extend. With just a few lines of code, you can write a plugin to monitor almost anything. Being so easy to extend means that Munin is also a good choice for graphing things unrelated to server performance, such as the number of user signups or website popularity.
4. Cacti
 Cacti is similar to Munin in many ways. What is makes Cacti different though–and where it stands out in relation to Munin–is that it allows you to resize your graphs and view data for an arbitrary range. Whereas Munin has fixed daily, weekly, monthly and yearly graphs (unless you write a custom extension), Cacti lets you view your data however you want to: last 2 hours, last 4 days, last 6 months, out of the box. You can even visually select and zoom into regions on your graphs.
5. Nagios
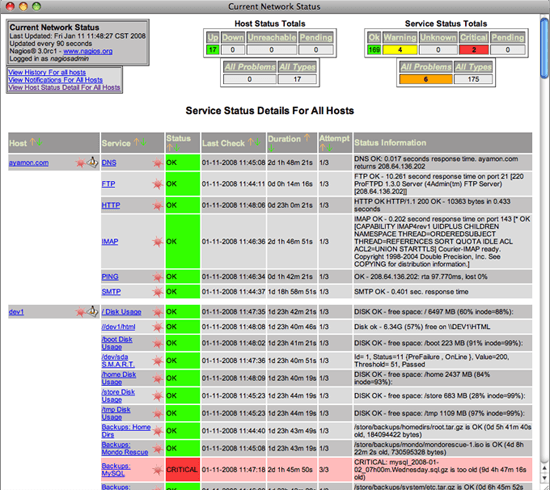 Nagios is “the industry standard in IT infrastructure monitoring,”–well, at least that’s what it says on their website. Nagios can be complicated to install and configure, but its wealth of features are unmatched by any tool out in the market and is geared for the experienced IT network administrator. Nagios supports monitoring of multiple hosts and can send out alerts via email, pager (if you still use this ancient technology) or SMS/text messaging. Like Monit, it can also be configured to automatically respond to problems.
6. Zabbix
 Zabbix is a feature-packed monitoring tool. It has great visualization support including user-defined views, zooming, and mapping. It can send out alerts via email, SMS or instant message. It also provides audible alerts, which can be useful when you’re physically near the monitoring machine.
7. ObserverNMS
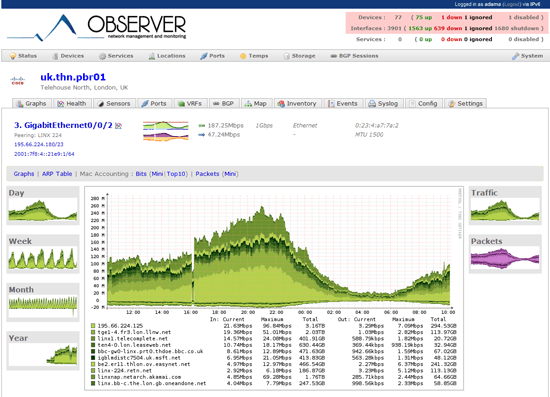 ObserverNMS is geared towards Linux, BSD and Cisco networks. It supports auto discovery of your network infrastructure, finding the networks that you’re likely interested in monitoring; this feature can be compared to how your Wi-Fi software automatically finds signals in range that you can jack into. ObserverNMS provides detailed graphs, and can be set up alongside Nagios to provide alerts. It also integrates well with Collectd (featured below) for a more robust interface.
8. Zenoss
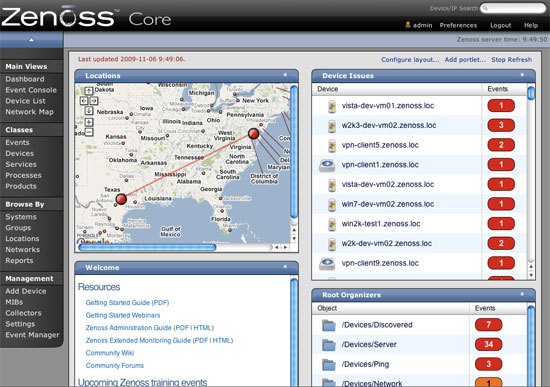 Zenoss is an open source version of the commercial server monitoring tool Zenoss Enterprise, written entirely in Python. It supports the Nagios plugin format, so many existing Nagios plugins can be used in Zenoss. One of the main highlights of Zenoss is its powerful yet simple to use user interface.
9. Collectd
 Collectd is similar to Munin and Cacti in that it focuses on graphing system metrics. Where it excels in is that it is designed specifically for performance and portability; this ultimately means it’s great on rugged systems, low-end systems, and embedded systems. Being designed for performance and low-system resource use means that Collectd can gather data every 10 seconds without interfering with your server processes, providing extremely high-resolution statistics. You can write extensions for it in C, Perl or Java.
10. Argus
 Argus focuses on the monitoring of network services, and supports IPv4 and IPv6. It has a nice alert escalation procedure: after sending out an alert and the problem still isn’t resolved within a fixed amount of time (because the systems admin is at home enjoying his sleep), another alert will be sent out to someone else. What do you use? Do you have experiences with any of the tools above? Do you use something else? Join our discussion in the comments.
Related Content
- Related categories: Tools and Web Development
About the Author
 Ben Dowling is a passionate software developer who specializes in web and mobile application development. He currently works for Mendeley in London, UK, and regularly blogs about development at Coderholic. You can also find him on twitter.
81 Comments
Chime Host
November 5th, 2009
We currently utilize Cacti but I am really liking the auto restart feature in Monit.
Alberto
November 5th, 2009
Missed: OpenNMS ( opennms.org )
Kurt Kraut
November 5th, 2009
That’s a good list of monitoring software. I’d like to also present to you the Poor’s Man Monitor, a project I’ve started last week. Its on early stages of development but can already be used in production.
It’s meant to be a monitoring system to be used on desktop, not on a central server.
Further details on my project at http://code.google.com/p/pomamonitor/
Tyler
November 5th, 2009
Where’s OpenNMS?
Peter
November 5th, 2009
We use Nagios and Cacti on our servers, works like a charm!
😀
simon
November 5th, 2009
Hobbit/xymon ?
the best open source network monitoring tool out there
Charly
November 5th, 2009
Great list Ben, and by the way, great Blog and articles on http://www.coderholic.com/ , I’ve been looking for one of those tools, I guess there’s none someone could install on a share server just to monitor one site or blog?
JeeSee
November 5th, 2009
After dubbing about open source network monitoring, I’ve tested several systems: Nagios, Zabbix, Hyperic and PandoraFMS. In combination with Microsoft clients my conclusion is that Zabbix and PandoraFMS were the best suitable in our network. In the end: PandoraFMS wins, because of the user-kindly webinterface and configuration of agents.
http://www.pandorafms.org
ruben
November 5th, 2009
Thanks you!
Michael
November 5th, 2009
Great post.
I’m a long-time user of Cacti (and MRTG before that, – it’s a great tool.
Some of the others a worth investigating. Thanks.
NOB
November 5th, 2009
We use ZABBIX. What is missing in your text is:
ZABBIX can fix problems in the same way like you mentioned for Monit and it has one of the best correlation engines
in the world ! That is not just my opinion, it seems.
See here: http://www.thecepblog.com/2009/03/23/a-review-of-zabbix-zabbix-rules-part-2/
NOB
November 5th, 2009
Nice list of tools.
We thought about replacing our in-house developed solution
for capacity management by collectd.
After reading all the texts for all the tools:
Everything you mention as 「special」 features in your blog for Nagios, Zenoss, Argus, Munin, Ganglia and Monit is integrated in ZABBIX out-of-the-box or can easily be done with ZABBIX, too.
The exception is the iPhone App for Monit, but ZABBIX supports Jabber. So any Jabber-client should work that way.
No experience with that, though.
ZABBIX is simply a good solution, especially for distributed monitoring (DMZ, remote sites, etc.)
Mark
November 5th, 2009
Don’t forget about monitoring the config of your devices – http://www.open-audit.org
Free, open, PHP, MySQL, Bash, VBScript. Audits Linux and Windows machines.
Ian Purton
November 5th, 2009
Status2K (which I own) provides a server monitoring service with the ability to see live statistics. This is great for monitoring a server and seeing what is happening right now.
Also Status2K provides the ability to view the logs and see bandwidth usage over time.
However it’s not free like the above tools, but we do offer great support. http://status2k.com
Ozzik
November 5th, 2009
I use Xymon (ex-Hobbit). Somehow not a lot of people know about it, but it’s a great monitoring tool.
Ingo Hoffmann
November 5th, 2009
You should add Opsera Opsview which is Nagios made right 🙂
slaFFik
November 5th, 2009
Really great list. Haven’t heard about most of them!
Thank you for collecting them all in one place.
Colum
November 5th, 2009
Great post. I was using munin but now I might look into some other programs.
Thomas
November 5th, 2009
This its the Point that a Good Site need. Because with your Traffic you need it ones more. Thanks for this great inside infos.
Pascal
November 5th, 2009
Thanks for the great roundup. I’m not personally a developer, do all these require work on your site/server to start monitoring?
I met an interesting chap last week who recently launched a wonderfully simple monitoring service called Nimbu.net. Without any coding this service will keep checking your sites are available and if not will email and sms you. Currently in beta.
Cheers
Rob
November 5th, 2009
Currently using Nagios for monitoring our production environment; coupled with a few net plugins (such as the JBoss Nagios plugin: http://www.jboss.org/community/wiki/JBossNagiosPlugin to monitor heap sizes).
Probably looking to combine Munin and Nagios to provide some utilization graphs as well.
Good post; have to say Observer looks interesting as well, with its auto-discovery feature.
Geo
November 5th, 2009
Another one to add to the list is called, The Dude, it’s a network monitor that automatically scans all devices within specified subnets and can draw and layout a map of your networks, monitor services of your devices and alert you in case some service has problems.
Rodrigo Freitas
November 5th, 2009
I use NINO, with good results. NINO is writen in PERL and has web access, graphics, notification and others. http://nino.sourceforge.net/
me
November 5th, 2009
Great article for linux and apache people! I have to monitor both types. Any suggestions for windows/asp.net crowds?
David
November 5th, 2009
MRTG – for not only routers and switches, but it does servers and services, laod balancing, temperature monitoring and it is free.
A great comercial packaage that i use is Link Analyst from Network Instruments – inexpensive, but has alerts and analysis builtin….web interface, multiple clients with segregated access…
Excellent list BTW…!
Phil C
November 5th, 2009
Mikrotik Dude is free and does everything all of these tools in the article do and more! without the hassle of configuring PHP and Web services.
Memoryweaver
November 5th, 2009
Excellent summary — I hadn’t realised there were so many free products out there. Do you have a favourite?
Glenbot
November 5th, 2009
Fantastic post! It’s nice to see something other than online design tools or CSS tips.
David Mytton
November 5th, 2009
I’d like to include http://www.serverdensity.com – a hosted internal server monitoring service for Linux & OS X that my startup provides, which does include a free option.
The tools you mention in this post are all excellent open source tools but often require a lot of time and effort to set up. They’re certainly suited to larger companies with big requirements for flexibility. Not so useful for smaller companies.
Joachim
November 5th, 2009
Does anybody know about a monitoring system, which checks, if there are trojans or other malware on my server/website?
Matt
November 5th, 2009
We use Xymon (http://www.xymon.com) at work for ~400 servers. It works well for that size of an environment. I’ve implemented Munin before, and tried Nagios and Zenoss, both of which were ridiculously complex to setup rules and notifications for (overly so). That’s probably because I’m so used to Big Brother / Xymon, but oh well.
Anyone else care to comment on the other products in a large environment?
makini
November 5th, 2009
We use Zabbix. It’s better geared for large-scale enterprises, collocation or service provider sized networks and amount of hosts. It stands in comparison to Zenoss and Nagois by capabilities and features.
Cacti and Monit are more single-host monitoring oriented. Others I’m not too familiar with.
Ed
November 5th, 2009
Thank you for the information. More than once, I have found myself in a position where a free version of some of these services was a need, but I wasn’t sure which tool would actually do it.
Also, this article needs to be proofread again.
Andrew Rodgers
November 5th, 2009
Don’t forget the monitoring & reporting tools built into webmin, over the last few years webmin has become a powerful tool with releases for most distros. You can set up customized email alerts, as well as default actions for services.
(Disclaimer: I use webmin a lot but am no way affiliated, and have not contributed to the project in any way)
Andrew
Sek
November 5th, 2009
So, The topic is not 「10 Free Server」 and 「10 Network Monitoring Tools」
It’s rather 「10 Free Server Monitoring Tools」 and 「10 Network Monitoring Tools」
By the way, Thanks for good article. I would change from Cacti to Monit tomorrow.
Matt Ray
November 5th, 2009
Thanks for the mention of Zenoss, but that screenshot is from version 1.1 and looks nothing like the application anymore. We just released version 2.5 last week, so I encourage your readers to check it out.
http://tr.im/core2_5_0
Kimball
November 5th, 2009
Nice post. I just started to get nagios installed for our network. It does take some reading and learning to configure everything correctly, but I’ve got it monitoring linux, novell, windows, printers, out phone system, and cisco routers and switches. I kinda wish I saw this post 2 weeks ago when I started this project. oh well.
mattymattmatt
November 5th, 2009
Great post. We use Cacti for our University network reporting.
Bryden
November 5th, 2009
GroundWork Open Source is another great monitoring tool. Provides an interface for Nagios config changes rather than editing text files. You can download the community edition for free.
Ben Pilkerton
November 5th, 2009
Sometimes a hosted solution is better/easier/more reliable. I’ve found both http://mon.itor.us/ and http://pingdom.com/ useful. RRDTool is a great tool if you want to roll your own.
NOC Guy
November 5th, 2009
We currently utilize Nagios and Cact. But we are looking for a program (or possible Cacti can be enhance) that will give customers realtime access without opening up our private network. Presently we have to forward customers utilization via report request.
Any suggestions?
Ben Dowling
November 5th, 2009
Thanks for the feedback and comments everyone, especially those listing monitoring tools that weren’t included on the list. There are lots out there!
Brian Nagy
November 5th, 2009
Little known but better than the few open source options I’ve tried (Big Brother, MRTG, Cacti)
is…. Traverse (http://www.zyrion.com/)
Good
November 5th, 2009
hey, great list of apps for monitoring servers and services. as my net presence expands and i include more hosts, these apps will help me keep an eye on what’s going on so my mind can keep an eye on the prize.
Aitor
November 5th, 2009
A great list and a nice work, thanks!!
Here you cand find another one, in Spanish: Pandora FMS
http://pandoramon.sourceforge.net/es/
http://pandorafms.org/
Stefano
November 5th, 2009
We are using the freeware version of PRTG Network Monitor from Paessler (I’d say that this is the best easy-to-use monitoring product for Windows)
dev_quest
November 5th, 2009
Nice list. I have been trying to setup some free monitoring for my blog. Been too lazy to do the research. Thanks for the list.
Steve Keller
November 5th, 2009
You should add 「wrapper」 products for Nagios that take away the difficult and time-consuming configuration files (AKA 「Here be dragons」). Both Opsview (which we use) and Groundwork have community editions that are free.
Antti Kokkonen
November 6th, 2009
I’ve been using Cacti which has been great, but I gotta say Monit’s iPhone App makes it tempting 🙂
Simon Gattner
November 6th, 2009
For simple live-monitoring of small and medium Websites I also use ALiveLog.
RG SYSTEMES
November 6th, 2009
Nice job Ben but it should be nice to do the same job for the SaaS Monitoring systems. We finished to develop some months ago a SaaS Monitoring Tool called RG-Supervision.
SaaS tools allow a new offer to the small and medium sized companies who don’t want to invest money and time before testing the product, who wants to be free to change tool, change supplier and easily stop to use the product. With the open-sources products, you still have a start invest to set up such a tool into a company and you need to have some internal competences to manage this tool… With SaaS product, you can open account immediately, you can use the interface directly, you can stop the relation at any time etc… Flexibility required by the company now !
If you are interesting by this new kind of tools, you could take a look at RG-Supervision.
Best regards,
Grégory
NetDiva
November 6th, 2009
GroundWork Monitor 6.0 is a great tool. The community edition is free and the enterprise edition is only $49 for 100 devices or less.
* Easy to install wizard to help optimize the monitoring performance.
* Availability monitoring to alert if devices are up or not.
* Ability to monitor servers, devices and applications that gives you the flexibility to monitor all of the integral components within your network.
* Performance monitoring to give insight on latency before a server is offline
* Basic auto-discovery and configuration tools to help identify additional devices on the network which is a great time-saving function if your network is constantly changing.
* Built on the same open-architecture as Enterprise Edition, Community Edition is easy to integrate and customize.
Tobbi
November 7th, 2009
Smokeping is also a great tool for network-monitoring.
http://oss.oetiker.ch/smokeping/
Japh
November 7th, 2009
I found a great tool for simple network monitoring today actually. It’s called MetaPing and it’s for 「visual ping monitoring」. Really simple, but great for monitoring latency and stuff on your servers.
peter
November 8th, 2009
I’d also suggest to keep an eye on ScopePort. http://www.scopeport.org – Seems to be a good combination of great usability with decent functionality.
Salvador
November 8th, 2009
FAN is a 「wrapped」 solution for Nagios/Centreon, up&running in less than 20 minutes:
http://fannagioscd.sourceforge.net/drupal/
Includes CentOS,Nagios,Centreon,Nagvis & NaReTo.
Also, OpenNMS 「sans effort」 includes CentOS&OpenNMS in a ISO image easy to deploy:
http://opennmsse.free.fr/
Just try them!
NOB
November 9th, 2009
To 「NOC Guy」
Why not use ZABBIX ?
It provides a good scheme for user access rights based
on host groups and the interface just needs a PHP-enabled Webserver and a Browser.
It gives you real time access to alarms and data.
HTH,
NOB.
Nacnude
November 9th, 2009
I have to cast my vote for Xymon (hobbit). We use it in a very large organization (all OS’s). It might be ugly but it’s quick and you see system graphs and statistics right away. Seems like with the others its either over-organized or slow to get system data quickly. Best troubleshooting and alerting tool I have used. Also, nice that the agent config (bbmon) updates with out restart it.
Ryan Matte
November 10th, 2009
I’ve been using Zenoss for almost a year now. It is very powerful. There are some types of monitoring info which I have had to write custom scripts to gather, but I am always impressed with just how easy it is to integrate custom scripts with Zenoss. The UI is very nice and a huge time saver (it is also in the process of getting a major overhaul to look and function even better). I suggest that you come take a look at Zenoss the new Zenoss community site: http://community.zenoss.org. Or stop by the IRC channel: irc.freenode.net – #zenoss
Jason Dixon
November 11th, 2009
Hi Ben,
Interesting article. I find there are bits of each app that are useful, but overall they all suffer from the 「built by techies for techies」 stigma. Zenoss is probably the most user-friendly in this list, and I like some of the ideas that ObserverNMS has introduced. Unfortunately, they still suffer from some major usability issues (IMHO).
Not to sound like a marketing droid, but you might want to keep an eye on Circonus. Built by the same folks working on Reconnoiter, I think it’s going to shake up some of the ideas in the monitoring/trending/ECA arena. We’re accepting beta signups now, if you’d like to try it out when it goes private beta.
Thanks,
Jason
Umar Draz
November 14th, 2009
Hi,
Nice article, for process management MONIT is great we can easily customized as per our requirements and the other end for graph management CACTI i think is better.
Thanks
Umar
akp982
November 16th, 2009
Thanks 🙂
Really nice article with some great software im going to give a try.
Cheers for sharing
Rick
November 19th, 2009
Good stuff! Thanks for pointing out Monit. I like the simple layout.
Another hosted server/service monitoring solution to consider is Panopta. It’s not totally free, but it does kick ass. 🙂
Monitor response times of service transactions simulating the end user experience with
http://zyrion.com/solutions/
Good!!
Add more interesting network monitoring tools in your list which enables you to quickly detect, diagnose, and resolve network performance problems and outages—before you start getting calls asking if the network is down.
check at
http://www.solarwinds.com